Le débat fait rage
A lack of consideration of a dose–response relationship can lead to erroneous conclusions regarding 100% fruit juice and the risk of cardiometabolic diseaseTauseef A. Khan European Journal of Clinical Nutrition volume 73, pages1556–1560(2019)
Sugar-sweetened beverages and 100% fruit juice: a tale of two dose-response analysesExcess intake of added sugars especially from sugar-sweetened beverages (SSBs) is associated with increased risk of obesity, type 2 diabetes, cardiovascular disease (CVD) and mortality [1]. Mounting evidence suggests that SSBs contribute a substantial proportion of daily intake of sugars [2] while offering no nutritional benefit; and it is the obesogenic effect of excess calories that increases the risk of cardiometabolic disease and mortality rather than any adverse effect of fructose-containing sugars [3]. The consistent relationship between SSBs and cardiometabolic disease outcomes in several large cohorts has shaped public health guidelines calling for the reduction of SSBs [4] and has resulted in a soda-tax within several countries.
In contrast to SSBs, whole fruits have always been a component of a healthy dietary pattern and its liquid form, 100% fruit juice, is also included as an option to meet the recommended targets for fruit and vegetable intake in some nutrition guidelines globally (
https://www.nhs.uk/live-well/eat-well/5 ... at-counts/). However, recently there have been attempts to group 100% fruit juices and SSBs as “sugary drinks” [5] as both have similar energy densities:
A typical 250 ml of 100% orange juice contains 110 kcal and 26 g of sugar; 250 ml of soda contains 105 kcal and 26.5 g of sugar. While equating SSBs and 100% fruit juice on sugar content makes logical sense, especially when we consider that liquid calories are less likely to be compensated [6], it ignores the fact that
100% fruit juice, in a similar manner to fruit, also provides health-promoting micronutrients such as vitamins, minerals and polyphenols which have health protective effects [7]. The question remains as to whether there is any evidence demonstrating an association between 100% fruit juice and cardiometabolic disease that is similar to that found with SSBs. Seeking a simple binary answer of harm or benefit would be overly simplistic as it disregards the complex relationships that exists between various foods, their nutrient matrix and disease. We propose that the evidence needed to assess if 100% fruit juices are similar to SSBs require us to understand the population level dose–response relationships.
Using aggregate data from categorical tables of three separate published studies reporting on disease associations for SSBs, 100% fruit juice or both (“sugary drinks”), we modelled a non-linear dose–response using the best fitting second-order fractional polynomial regression [8]. In Fig. 1a, using data from the Health Professionals’ Follow-up Study and the Nurses’ Health Study, the dose–response association of SSBs with total mortality follows a linear model: [9]. A similar linear dose–response is also found in other prospective cohort studies assessing the relationship between SSBs and CVD mortality [9], type 2 diabetes [10], metabolic syndrome [11] and hypertension [12]. Therefore, studies are correct in reporting disease associations for SSBs as linear analyses or highlight extreme comparisons, which assumes linearity, because the results are consistent with the linear risk curve across the whole dose range.

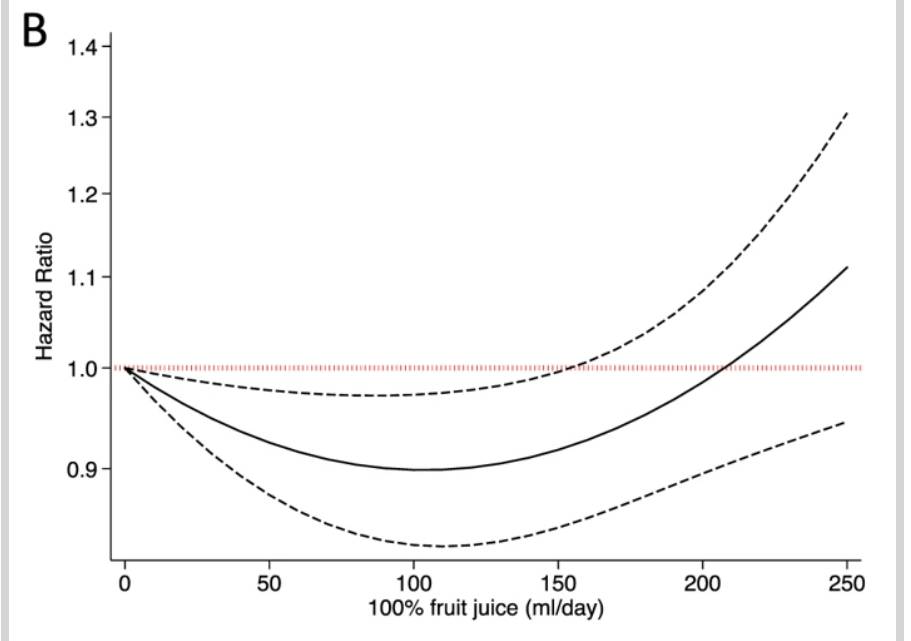
Dose–response relationship of a. SSBs with total mortality [9], b. 100% fruit juice with CVD incidence [13] and c. sugary beverages (SSBs + 100% fruit juice) with total mortality [5]. For each study we modelled the non-linear dose–response using the best fitting second-order fractional polynomial regression using summarised data [8]
However, this is not the case with 100% fruit juice. In Fig. 1b, data analysed from a large European cohort [13] demonstrate a
non-linear J-shaped curve, revealing a protective association between 100% fruit juice and CVD incidence at moderate doses but indicating harm at higher doses. The curve demonstrates a maximum benefit at doses from 100 to 150 ml/day, which is equal to a small glass of 100% fruit juice. Similar non-linear protective associations at moderate doses for 100% fruit juice consumption are also seen with stroke [13], type 2 diabetes [10], metabolic syndrome [14] and hypertension [15] (there are no studies reporting an association between 100% fruit juice and total mortality). Therefore, reporting linear or extreme comparison analysis that assumes linearity between 100% fruit juice and cardiometabolic disease outcomes would be incorrect. The results from such analyses would only apply at high intakes and the overall conclusions reached would be spurious as they mask any protective associations at moderate doses.


